
How much does a landed property cost in Singapore? The answer depends on far more than its district or price per square foot (PSF).
Land tenure, plot characteristics, building condition and redevelopment potential can all influence a landed property's value. Even two homes along the same street may command significantly different prices.
To understand these differences, PropertyGiant analysed 2,114 landed property transactions across Singapore between November 2025 and October 2026, using URA Realis caveat data.
The findings reveal substantial variations in transaction activity, pricing and land tenure across Singapore's landed property districts.
More importantly, they highlight why understanding the numbers is only the beginning. Knowing how to interpret those numbers in relation to an individual property is what makes market analysis valuable.
Singapore Landed Property Market at a Glance

Market at a Glance
Transaction Overview (All Landed Properties)
(PSF)
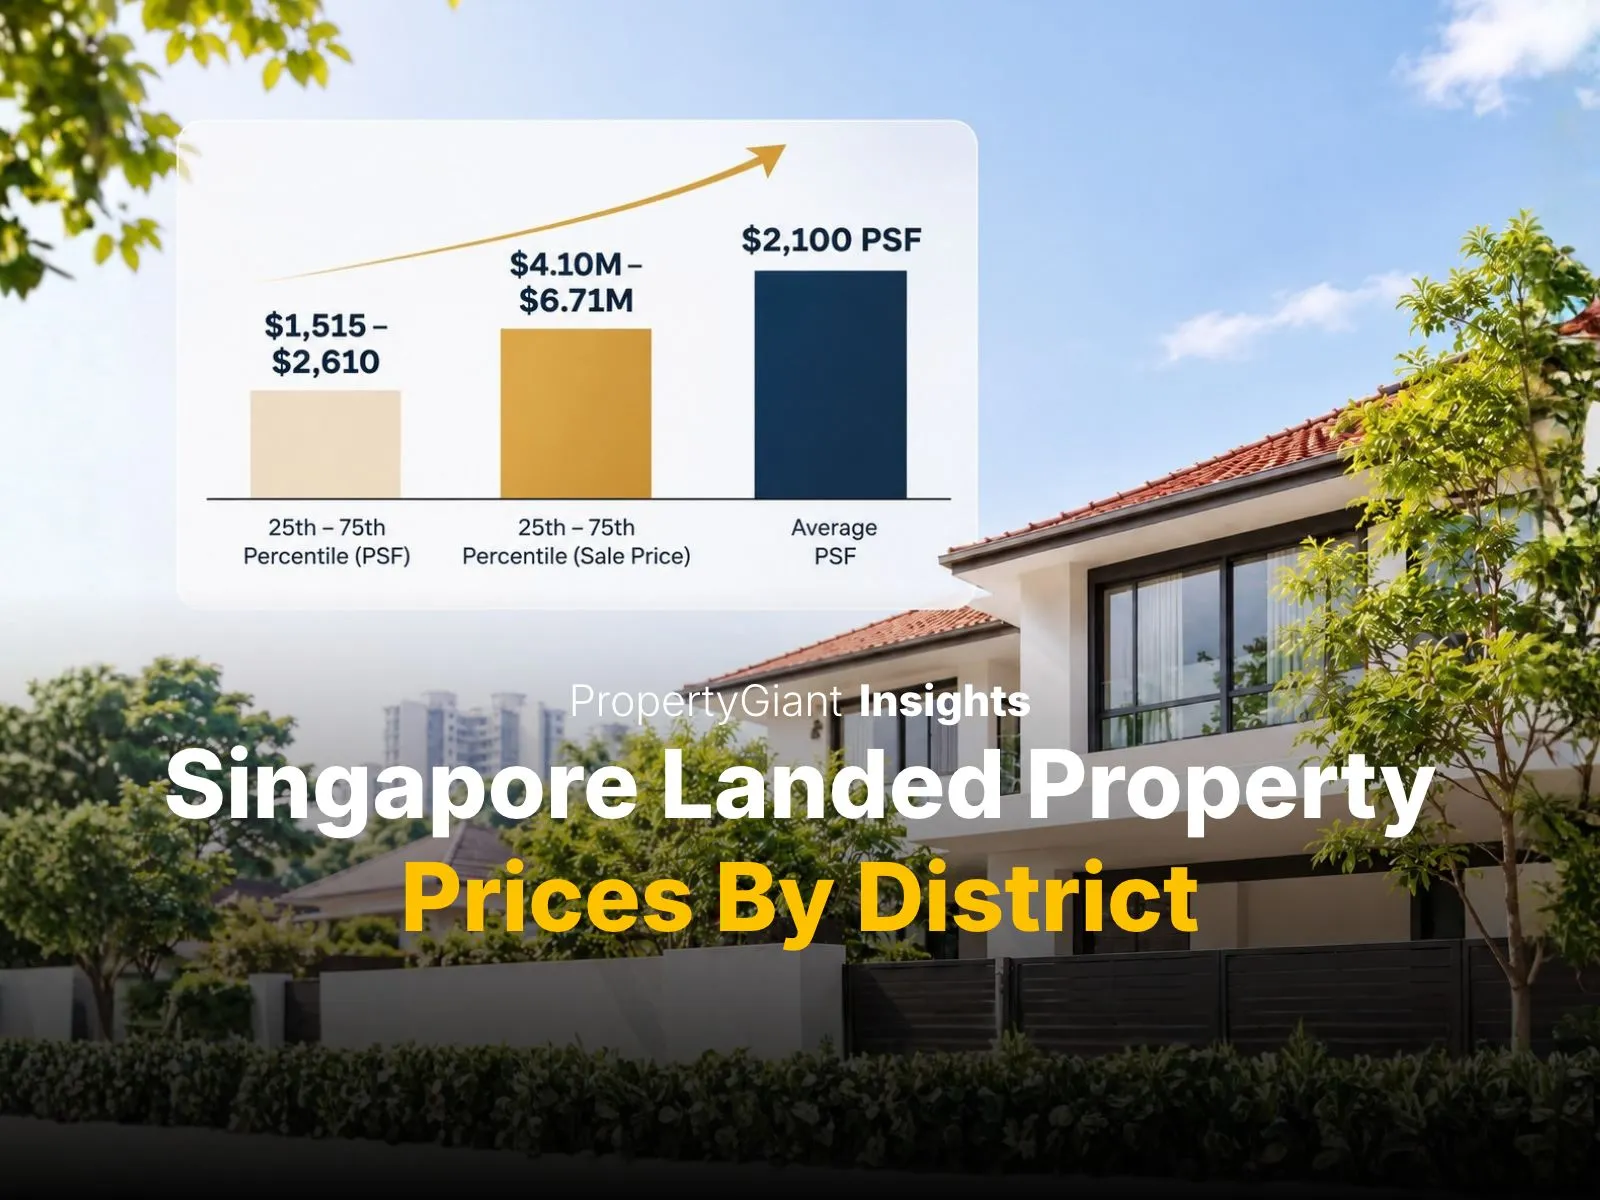
Between November 2025 and October 2026, the 2,114 landed property transactions analysed recorded an average sale price of S$6.34 million and an average transacted price of S$2,100 PSF.
However, averages alone do not fully represent Singapore's diverse landed property market.
The middle 50% of transactions, measured using the 25th and 75th percentiles, fell within these ranges:
- Transacted PSF: S$1,515 to S$2,610
- Sale Price: S$4.10 million to S$6.71 million
These substantial ranges reflect differences in land tenure, location, property type, land size and building condition.
For buyers and homeowners, these figures provide a useful starting point. However, they combine freehold, 999-year and shorter-leasehold properties, which can have distinctly different pricing characteristics.
A more meaningful comparison begins by examining these tenure categories separately.
This brings us to an important question:
Freehold & 999-Year vs 99-Year Landed Properties: How Much Is the Price Difference?
Land tenure is one of the key considerations when evaluating landed property prices in Singapore.
Of the 2,114 transactions analysed, 1,741 transactions (82.4%) involved freehold and 999-year properties, while the remaining 373 transactions (17.6%) fell within the shorter-leasehold category.
The difference in average transaction prices was substantial.
Singapore Landed Property Prices
Transaction analysis by land tenure
| Market Metric |
Freehold / 999-Years |
99-Years | All Properties |
|---|---|---|---|
| Total Transactions | 1,741 | 373 | 2,114 |
| Average PSF | S$2,242 | S$1,437 | S$2,100 |
| Average Sale Price | S$6,968,328 | S$3,388,735 | S$6,336,735 |
| 25th Percentile PSF | S$1,712 | S$985 | S$1,515 |
| 75th Percentile PSF | S$2,682 | S$1,740 | S$2,610 |
| 25th Percentile Price | S$4,550,000 | S$2,598,000 | S$4,100,000 |
| 75th Percentile Price | S$7,200,000 | S$4,000,000 | S$6,706,750 |
Freehold and 999-year landed properties recorded an average PSF approximately 56% higher than shorter-leasehold properties, alongside an average sale price difference of approximately S$3.58 million.
However, this should not be interpreted as a direct premium attributable solely to tenure.
A newly constructed 99-year landed home may command a higher PSF than an older freehold property requiring extensive renovation. Similarly, differences in land size and neighbourhood characteristics can significantly influence transaction values.
At PropertyGiant, we look beyond tenure and headline PSF figures to understand how a property's individual characteristics influence its market positioning. This is particularly important for landed homes, where no two properties are exactly alike.
Location is another major factor. The following district-level analysis reveals where transaction activity was concentrated and how pricing differed across Singapore.
Which Singapore Districts Recorded the Most Landed Property Transactions?
Transaction volume offers insight into where landed property activity was concentrated during the analysis period.
District 19 recorded the highest number of transactions, followed by District 28 and District 15.
While transaction volume indicates market activity, it does not necessarily reflect stronger demand or faster sales. Districts with a larger supply of landed properties may naturally record more transactions.
The differences become clearer when examining the three most active districts individually.
District 19: Singapore’s Most Active Landed Property District
Comprising established landed residential neighbourhoods such as Serangoon Gardens, Kovan, Hougang and parts of the Upper Serangoon area, District 19 recorded the highest number of landed property transactions in Singapore between November 2025 and October 2026.
With 358 transactions, accounting for approximately 16.9% of the 2,114 landed property transactions analysed nationwide, District 19 emerged as the most active district by transaction volume.
District 19 Landed Property Prices: S$5.46 Million on Average
Across all landed property transactions in District 19, the average sale price stood at S$5.46 million, with an average transacted price of S$2,016 PSF.
Looking beyond averages, the middle 50% of transactions fell within the following ranges:
- Transacted PSF: S$1,597 to S$2,427
- Sale Price: S$4.2 million to S$6.37 million
These figures provide a useful indication of the price spectrum within District 19, where landed properties vary considerably in land size, age, condition and redevelopment potential.
Freehold and 999-Year Properties Dominated Transactions
Of the 358 landed property transactions recorded, 315 transactions (88.0%) involved freehold and 999-year properties, while the remaining 43 transactions (12.0%) fell within the shorter-leasehold category.
Freehold and 999-year landed properties recorded an average sale price of S$5.76 million at S$2,080 PSF, compared with S$3.31 million at S$1,551 PSF for shorter-leasehold properties.
This represents a difference of approximately 34.1% in average PSF, with freehold and 999-year properties commanding an average sale price approximately S$2.45 million higher.
The 25th to 75th percentile ranges further illustrate the differences between the two segments:
- Freehold / 999-year properties: S$1,668 - S$2,515 PSF, with sale prices between S$4.53 million and S$6.57 million.
- Shorter-leasehold properties: S$1,372 - S$1,801 PSF, with sale prices between S$3.08 million to S$3.50 million.
While the data indicates higher transaction values for freehold and 999-year properties, differences in land size, location and property characteristics may also contribute to the pricing gap.
Why Is District 19 So Active?
District 19 encompasses an extensive collection of established landed housing estates, offering buyers a broad selection of property types, from older inter-terrace houses and semi-detached homes to newly rebuilt landed residences.
Neighbourhoods such as Serangoon Gardens and Kovan are particularly well-established residential enclaves, with access to amenities, schools and transport connections.
The district's diverse landed housing stock also caters to different buyer profiles, including families seeking homes for their own occupation, buyers considering renovation or reconstruction, and those looking for newly completed landed properties.
District 19's leading transaction volume highlights its significance within Singapore's landed property market. However, a higher number of transactions does not necessarily mean stronger buyer demand. It is also important to consider how many landed properties there are in each district, as districts with more landed homes naturally tend to have more transactions..
For buyers and homeowners, the district-wide figures provide a valuable starting point. A more precise understanding of property value ultimately requires comparison with transactions involving similar landed property types, land sizes, tenure and locations within District 19.
District 28: Significant Activity Across Different Tenures
Covering established landed residential enclaves such as Seletar Hills, Yio Chu Kang and parts of the Jalan Kayu area, District 28 recorded 258 landed property transactions between November 2025 and October 2026, making it Singapore's second most active landed property district.
Accounting for approximately 12.2% of the 2,114 landed property transactions analysed nationwide, District 28 recorded higher transaction activity compared to District 15 across both freehold and leasehold properties during November 2025 to October 2026.
An important characteristic of District 28 is its mix of established landed estates and newer landed developments, including Luxus Hills, Pollen Collection I and Pollen Collection II. These developments contribute to the district's diverse housing stock and are relevant when examining its transaction activity and pricing patterns.
District 28 Landed Property Prices: S$4.83 Million on Average
Across all landed property transactions in District 28, the average sale price stood at S$4.83 million, with an average transacted price of S$2,035 PSF.
Looking beyond averages, the middle 50% of transactions fell within the following ranges:
- Transacted PSF: S$1,348 to S$2,614
- Sale Price: S$4.17 million to S$5.50 million
These figures reflect the diversity of District 28's landed property market, which comprises older landed homes, renovated resale properties and newly developed residences.
Freehold and 999-Year Properties Accounted for 69.4% of Transactions
Of the 258 landed property transactions recorded, 179 transactions (69.4%) involved freehold and 999-year properties, while the remaining 79 transactions (30.6%) fell within the shorter-leasehold category.
This represents a notably higher proportion of shorter-leasehold transactions compared with District 19, where the corresponding share was approximately 12.0%.
The presence of 99-year leasehold landed developments such as Luxus Hills, Pollen Collection I and Pollen Collection II, developed by Bukit Sembawang Estates, is particularly relevant when interpreting District 28's transaction composition.
These developments introduce newer landed homes into the district's shorter-leasehold market, distinguishing it from areas where leasehold transactions may predominantly involve older resale properties.
Why Did 99-Year Landed Properties Record a Higher Average PSF?
One of the most interesting findings in District 28 is the relatively small difference in average PSF between the two tenure categories.
Freehold and 999-year landed properties recorded an average transacted price of S$2,010 PSF, compared with S$2,090 PSF for shorter-leasehold properties.
In fact, the shorter-leasehold category recorded an average PSF approximately 4.0% higher than the freehold and 999-year category.
This contrasts with the broader Singapore landed property market, where freehold and 999-year properties generally recorded higher average PSF values.
A possible explanation lies in the composition of District 28's leasehold market, particularly the presence of Luxus Hills, Pollen Collection I and Pollen Collection II.
These developments offer relatively modern landed residences, with contemporary architectural designs, functional layouts and specifications that may appeal to buyers seeking homes with fewer immediate renovation requirements.
Unlike older landed properties that may require extensive upgrading or reconstruction, newer landed homes can command higher PSF values because of their building condition, design and overall product positioning.
Transactions involving newer leasehold developments such as Luxus Hills and the Pollen Collection projects may therefore have contributed to District 28's 99-year segment recording an average PSF comparable to, and slightly higher than, its freehold and 999-year segment.
This illustrates an important distinction: a higher PSF does not necessarily indicate that leasehold land is more valuable than freehold land. The price paid may also reflect the property's age, condition, built form and development characteristics.
Looking Beyond PSF: Freehold Properties Still Recorded Higher Sale Prices
Despite the similar average PSF values, the difference in total transaction prices remained substantial.
Freehold and 999-year landed properties recorded an average sale price of S$5.22 million, compared with S$3.94 million for shorter-leasehold properties, a difference of approximately S$1.28 million.
The 25th to 75th percentile ranges further illustrate the differences between the two segments:
- Freehold / 999-year properties: S$1,352 - S$2,564 PSF, with sale prices between S$4.42 million and S$5.77 million.
- Shorter-leasehold properties: S$1,317 - S$2,616 PSF, with sale prices between S$3.35 million and S$4.24 million.
Interestingly, the PSF ranges of both tenure categories overlap considerably, reinforcing the importance of evaluating property characteristics beyond tenure.
At the same time, the higher overall sale prices for freehold and 999-year properties suggest that differences in land size and the types of homes transacted may also play a role.
What Makes District 28's Landed Property Market Distinctive?
District 28 offers a combination of established landed housing estates and newer residential developments, creating a diverse market for buyers with different budgets and preferences.
The presence of developments such as Pollen Collection also demonstrates how new project launches can influence district-level transaction statistics, particularly when a meaningful number of transactions fall within a specific tenure category.
District 28 provides an important example of why landed property prices should not be assessed based on tenure alone. While freehold and 999-year properties recorded higher average sale prices, shorter-leasehold properties achieved a comparable average PSF, potentially influenced by the presence of newly developed landed homes.
For buyers and homeowners, this reinforces the importance of comparing properties with similar land sizes, locations, building conditions and development characteristics to obtain a more meaningful understanding of market value.
District 15: Strong Landed Property Activity Along Singapore's East Coast
Encompassing established residential neighbourhoods such as Katong, Joo Chiat, Marine Parade, Siglap and Frankel Estate, District 15 recorded 248 landed property transactions between November 2025 and October 2026, making it Singapore's third most active landed property district.
Accounting for approximately 11.7% of the 2,114 landed property transactions analysed nationwide, District 15 remains an important segment of Singapore's landed property market, particularly for buyers seeking homes in established East Coast neighbourhoods.
Unlike Districts 19 and 28, where transactions were recorded across both freehold and shorter-leasehold categories, all 248 transactions analysed in District 15 involved freehold and 999-year properties with no transactions for 99-year properties during the period November 2025 to October 2026.
This makes District 15 particularly interesting when examining landed property prices without the influence of shorter-leasehold transactions.
District 15 Landed Property Prices: S$7.19 Million on Average
Between November 2025 and October 2026, District 15 recorded 248 caveated landed property transactions, comprising both resale and new sales of inter-terrace, corner terrace, semi-detached and detached houses. The average sale price stood at S$7.19 million, with an average transacted price of S$2,560 PSF. Transaction prices ranged from S$2.45 million to S$26.5 million, reflecting the wide range of landed property values within the district.
This places District 15 above both District 19 (S$5.46 million) and District 28 (S$4.83 million) in terms of average sale price, despite recording fewer transactions.
Looking beyond averages, the middle 50% of transactions fell within the following ranges:
- Transacted PSF: S$2,110 to S$2,970
- Sale Price: S$4.82 million to S$8.59 million
These figures reflect the broad spectrum of landed homes available across District 15, ranging from older properties with renovation or rebuilding potential to newly constructed residences in established neighbourhoods.
Freehold and 999-Year Properties Accounted for 100% of Transactions
One of the most distinctive findings in District 15 is its transaction composition.
All 248 landed property transactions recorded during the analysis period fell within the freehold and 999-year category, with no transactions recorded under the shorter-leasehold category in the dataset.
This contrasts with District 19, where freehold and 999-year properties accounted for 88.0% of transactions, and District 28, where they represented 69.4%.
District 15's transaction profile is consistent with its established landed residential enclaves, many of which comprise freehold properties.
For buyers prioritising long-term land ownership, this is a noteworthy characteristic of the district's landed housing market.
However, the absence of shorter-leasehold transactions in the analysed period should not be interpreted as confirmation that no such properties exist within District 15.
How Do District 15's Landed Property Prices Compare?
District 15 recorded an average transacted price of S$2,560 PSF, compared with S$2,016 PSF in District 19 and S$2,035 PSF in District 28.
This represents an average PSF approximately:
- 27.0% higher than District 19
- 25.8% higher than District 28
The differences are also evident in the 25th to 75th percentile ranges.
In District 15, the middle 50% of landed transactions occurred between S$2,110 and S$2,970 PSF, compared with S$1,597 - S$2,427 PSF in District 19 and S$1,348 - S$2,614 PSF in District 28.
Notably, District 15's 25th percentile PSF of S$2,110 was higher than the average PSF recorded across both Districts 19 and 28.
This highlights District 15's relatively elevated pricing position among Singapore's most active landed property districts.
Nevertheless, these district-level comparisons should be interpreted with consideration for differences in land sizes, property types, building conditions and neighbourhood characteristics.
What Makes District 15's Landed Property Market Distinctive?
District 15 combines established landed residential neighbourhoods with the lifestyle appeal of Singapore's East Coast.
Areas such as Siglap, Frankel Estate and Joo Chiat offer a mix of traditional landed homes, renovated residences and newly rebuilt properties, while the wider district provides access to East Coast Park, dining establishments, schools and everyday amenities.
The district's proximity to the East Coast recreational corridor and its established residential character contribute to its appeal among buyers seeking landed homes for their own occupation.
Another defining characteristic is the variety of landed property opportunities available. Older houses may attract buyers considering extensive renovation or reconstruction, while newer residences appeal to those seeking contemporary layouts and modern specifications.
District 15 stands out for combining substantial transaction activity with relatively high landed property prices. Its 248 transactions demonstrate an active market, while its average sale price of S$7.19 million and average of S$2,560 distinguish it from Districts 19 and 28.
For buyers and homeowners, District 15's figures reinforce the importance of understanding how location, land tenure and individual property characteristics influence landed property values. Even within the same district, prices can vary significantly between different neighbourhoods and property types.
Which Districts Have the Highest Average Landed Property Prices?
While Districts 19, 28 and 15 have the highest transaction volumes, Districts 10 and 11 recorded the highest average landed property sale prices.
District 10, encompassing areas such as Bukit Timah and Holland, recorded 135 transactions at an average sale price of S$13.25 million and S$2,482 PSF from November 2025 to October 2026.
District 11, covering Newton and Novena, recorded 111 transactions at an average sale price of S$12.62 million and S$2,642 PSF from November 2025 to October 2026.
Both districts recorded average sale prices exceeding S$12 million, reflecting the higher transaction values associated with their landed property markets.
However, a higher average sale price does not necessarily mean every property within the district commands a higher PSF.
Average landed property prices can vary significantly depending on factors such as land size, property type (terrace, semi-detached or detached houses), and whether the transactions involve resale or brand-new homes.
For buyers evaluating prime landed districts, understanding what contributes to a property's price is often more useful than comparing district averages alone.
Why Average PSF Alone Cannot Determine a Landed Property's Value
Price per square foot is one of the most commonly referenced metrics in Singapore's landed property market.
However, unlike condominium units, landed properties are highly individual assets.
Two homes within the same district may have similar land areas but substantially different transaction prices.
Factors that can influence value include:
- Land Tenure: Whether the property is freehold, 999-year leasehold or shorter leasehold, including its remaining lease.
- Land Size and Shape: Total land area, plot shape, frontage, depth, facing, orientation and how efficiently the land can be used.
- Property Type: Whether the property is an inter-terrace, corner terrace, semi-detached or detached house.
- Building Condition: Whether the house is in its original condition, renovated, reconstructed or newly built, including its age and maintenance.
- URA Master Plan and Zoning: Planning restrictions under the URA Master Plan, including areas designated for bungalows, semi-detached houses or mixed landed housing, which can affect redevelopment possibilities.
- Building Height Restrictions: Whether the property is subject to a maximum building height of 12m or 15.5m, or other applicable height controls, which can affect rebuilding plans.
- Redevelopment Potential: Whether the land can accommodate a larger house, a different landed property type or subdivision, subject to URA guidelines and relevant approvals.
- Parking Conditions: Availability of on-site parking, the number of cars the property can accommodate and surrounding street parking restrictions.
- Location and Amenities: Proximity to MRT stations, schools, shopping malls, parks and other everyday conveniences.
- Nearby Religious Buildings: Proximity to mosques, churches, temples and other places of worship, including possible effects on traffic, parking and noise during peak periods.
- Feng Shui Considerations: Property facing, orientation, layout, surrounding roads and other features that may influence buyers with specific feng shui preferences.
- Neighbouring Properties: The condition, upkeep, height and appearance of neighbouring houses, as well as their proximity and potential impact on privacy, natural light and ventilation.
- Buyer Demand: Whether the property appeals to families looking for a home, buyers planning to rebuild or developers seeking land for redevelopment.
A property with a higher PSF may offer a newly completed home with modern specifications, while a lower-PSF property may require substantial rebuilding or renovation expenditure. Consequently, neither transaction price nor PSF should be assessed in isolation.
How PropertyGiant Translates Market Data into Property Strategy
Market data tells us what has transacted. Understanding why those properties achieved their prices and how that applies to a specific home requires deeper landed property expertise.
At PropertyGiant, our approach goes beyond comparing recent caveats and recommending an asking price.
As a dedicated team focusing on Singapore's landed property market, we combine several areas of expertise to develop strategies tailored to individual properties.
1. Landed Property Market Intelligence
Our specialists analyse comparable transactions, tenure, land characteristics and buyer preferences to understand where a property stands within its market.
Rather than relying on district-wide averages, we examine the factors that distinguish a property from competing homes and identify the buyer segments most likely to appreciate its value.
2. Developer Network and Redevelopment Insights
As a leading real estate platform specialising in landed properties, PropertyGiant combines extensive market knowledge, strategic marketing and a network of over 300 developers to connect properties with the right buyers.
Through one integrated ecosystem, PropertyGiant brings together homeowners, homebuyers and developers, identifying opportunities based on location preferences, land characteristics and redevelopment potential.
This is particularly valuable for older landed properties, where the land's redevelopment potential may appeal to developers beyond buyers looking for a home.
3. Integrated Marketing and Extensive Buyer Reach
Effective property marketing requires more than simply listing a home online. It requires reaching the right audience.
PropertyGiant combines coordinated sales, in-house marketing, professional media production and data insights to create targeted marketing strategies that highlight each property's unique strengths.
Our established social media presence provides extensive reach to an audience already interested in Singapore's real estate market. PropertyGiant's content attracts viewers who actively follow property listings, market trends and real estate opportunities.
This allows us to showcase properties to a more relevant audience, whether they are homebuyers seeking their next residence, investors exploring opportunities or developers looking for land to redevelop.
4. Team-Based Execution
Selling a landed property involves multiple considerations, from pricing and presentation to buyer qualification, viewings, negotiations and transaction coordination.
PropertyGiant's team-based model brings together specialists and dedicated support functions, providing a coordinated approach throughout the selling process.
Engage One PropertyGiant. Gain the Expertise of Many.
What Should Landed Property Buyers and Homeowners Take Away?
The 2,114 transactions between November 2025 and October 2026 analysed reveal an important characteristic of Singapore's landed property market: there is no single benchmark that accurately represents every landed home.
For homeowners, a successful selling strategy begins with understanding how a property's tenure, land characteristics, condition and redevelopment potential influence its market value.
Beyond the property itself, PropertyGiant takes time to understand each homeowner's plans, financial commitments and preferred timeline. From coordinating the sale and next property purchase to planning key financial milestones, we help structure the entire process to ensure a smooth transition.
Our approach considers not just achieving the right selling price, but also aligning the sale, finances and timelines with the family's next chapter in their property journey.
For buyers, evaluating a landed property requires looking beyond its asking price or PSF to consider long-term suitability, renovation requirements and the property's underlying land attributes.
For developers, opportunities depend not only on land prices but also on location suitability, planning considerations, redevelopment feasibility and potential return on investment (ROI)..
The value of market intelligence lies not simply in having access to transaction data, but in knowing how to apply it to individual property decisions.
At PropertyGiant, we bring together landed market specialisation, developer connections, data-driven insights and coordinated marketing capabilities to help clients navigate these considerations.
Whether you are considering selling your landed property, purchasing your next home or exploring redevelopment opportunities, our team can provide a tailored assessment of your property's market position and potential.
Speak with PropertyGiant to understand what your landed property could mean to the right buyer.
Disclaimer
This article is prepared by PropertyGiant for general information and market commentary purposes only. The analysis is based on 2,114 landed property transactions recorded in the dataset derived from URA Realis caveat information for the period November 2025 to October 2026.
The figures, including transaction volumes, average prices, average PSF and percentile ranges, are historical statistics based on the transactions included in the dataset. They may not represent all market activity, current property values or future market performance.
For statistical comparison, the Freehold / 999-Years category includes freehold properties and leasehold tenures exceeding 150 years, while the 99-Years category includes 70-, 99-, 102- and 103-year tenures. These classifications are analytical groupings and do not alter the legal tenure of individual properties.
Comparisons between districts and tenure categories may be affected by differences in land size, property type, building condition, location, transaction composition and other property-specific characteristics. References to individual developments are illustrative and should not be interpreted as confirmation of their contribution to transaction statistics unless separately verified.
All information is provided without warranty as to its accuracy, completeness or continued relevance. Nothing in this article constitutes a property valuation, investment recommendation or professional legal, financial or planning advice. Buyers, sellers and other interested parties should conduct their own due diligence, independently verify relevant information and seek appropriate professional advice before making property-related decisions.